Gold
Gold remained flat to start last week, but it then turned volatile on Wednesday as we anticipated to mark a high of $1830 levels on Thursday. Friday it started falling back to settle near $1812 levels.
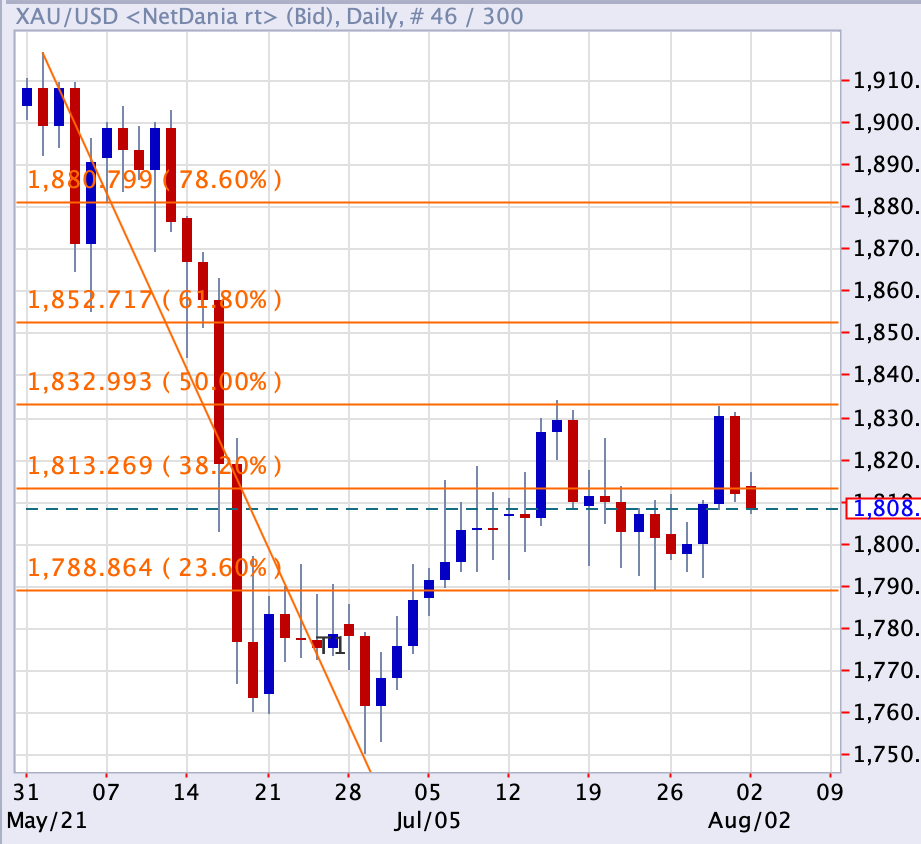
Technically, after forming a hammer close of Daily chart on 15th July followed by double top formation near $1830 levels . Gold could take a dip towards $1788 levels this week , its 23.6% Fibonacci retracement support ( $1916 – $1750).
Silver
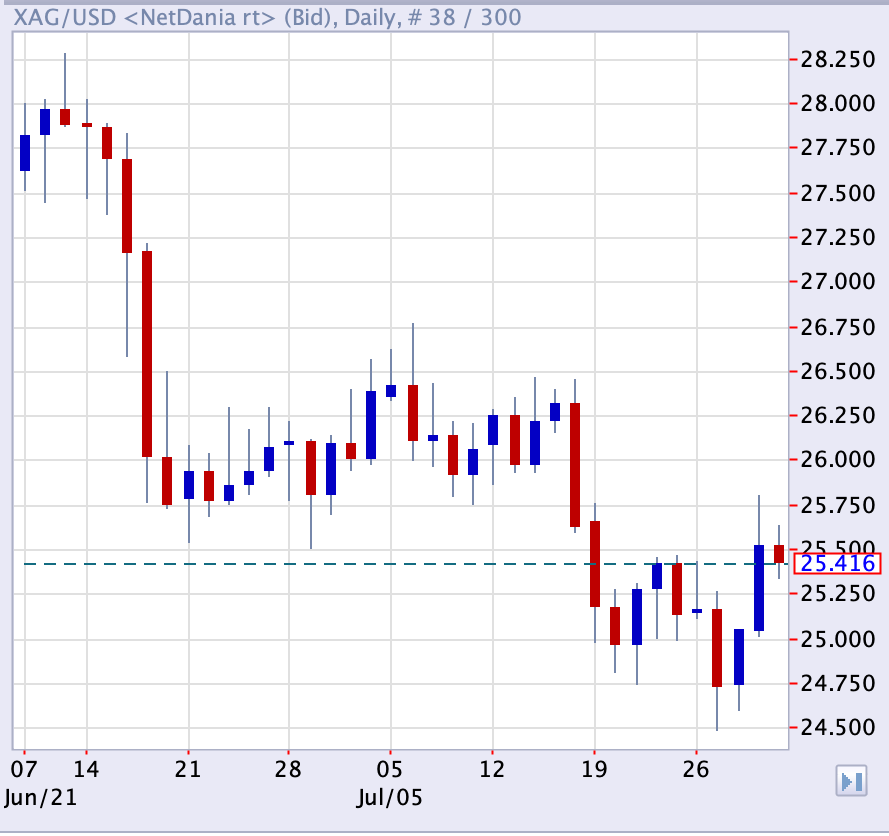
Silver tried to reverse its recent losses on last Thursday, but yet again got rejected near $25.75 levels. More or less the trading levels seems to the same as of last week, where resistance is seen at at $25.80 and silver could see falling towards its weekly trend line support at $24 levels. A daily close above $25.80 levels will change the cur-rent chart scenario for silver.
Platinum and Palladium
Platinum fell to $1033 which is near to its June lows. On Daily chart picture platinum has formed a Hammer kind of formation, which indicates that platinum could now try to march towards $1080 and attempt to trade above $1100 this week.
Palladium fell to $2590 levels last week and bounced back to $2670 levels , on a short term charts period palladium indicates momentum gains and could trade back above $2715 levels.
Data and Events for this week
- ISM services on Wednesday 4th August
- Non Farm Employment Change on Aug 6th
- Unemployment Rate on Friday