


Gold started off last week at $ 1775 levels and climbed to $1790, but quickly fell back and it traded to a low of $ 1764 levels on Tuesday. Later every time when it fell back gold did tried to take on its resistance but found tough resistance at $ 1797 levels and settled the week near to where it opened at $ 1775 levels. Gold was on a sideways pattern on charts as it touched both of its support and resistance for multiple times in past week. Rising bond yield and optimism in the latest economic report out of U.S capped gold’s gain last week.
Earlier today, Gold climbed back above $ 1780 and posted a high of $ 1783 in early asian hours of trade, but fell back and currently it is trading near $ 1776 levels. Later this week on Wednesday FOMC statement followed by Advance GDP results on Thursday are the two major fundamental news release out of U.S. FOMC statements gives clarity to investors about the recent monetary policy. It contains the outcome of their vote on interest rates and other policy measures, along with commentary about the economic conditions that influenced their votes. Most importantly, it discusses the economic outlook and offers clues on the outcome of future votes.
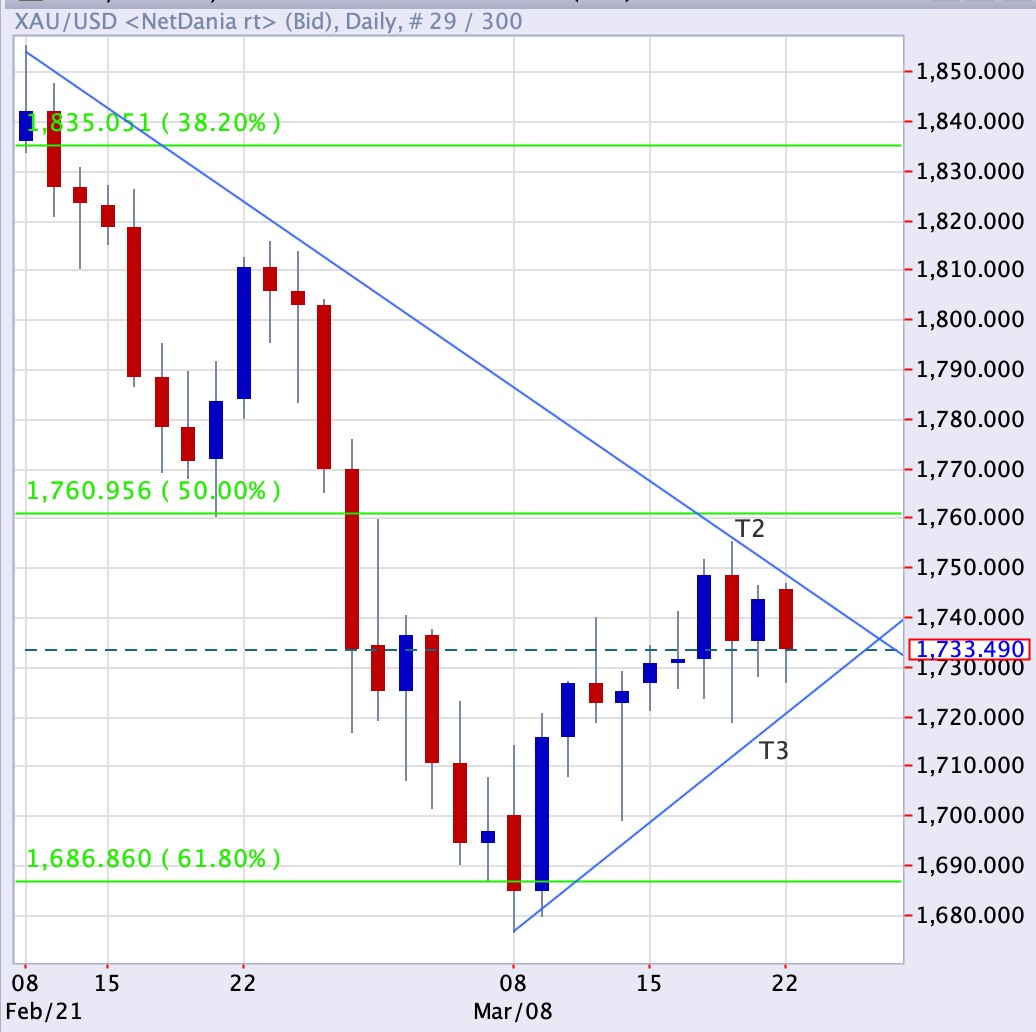
Technically, Weekly chart indicates a Doji formation, which indicates gold could fall back to test its support again, meanwhile a break and trade above $ 1802 the moving resistance could change the weekly picture. Daily chart indicates gold has resistance at $1786 and support at last weeks low of $ 1763.
Data and Events for U.S this week
- S FOMC statement on 28th April
- FED Fund rates on Wednesday 28th of April
- Advance GDP quarter to quarter on Thursday 29th April.
Bullion mart is one of the Canada’s leading Gold and Silver Dealers, Bullion mart now provides its client in UAE with the best possible customer experience in Bullion trading. We are one of the only authorized distributor of Royal Canadian Mint products in the U.A.E. All of our stocks can be selected in our website www.bullionmart.ae and www.bullionmart.ca. The news report mentioned here is not to be seen as an investment advice. Report is gathered from reputable online resources and chart source is Netdania.